The USERindex is a benchmarking score created in 2014. To date, the USERindex has been used in over 450 studies across 50 countries and has been adopted by companies worldwide as their default benchmarking system.
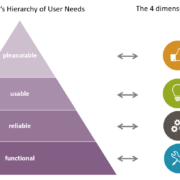
The USER in USERindex represents 4 dimensions: Usefulness, Satisfaction, Ease of use and Reliability. Capturing these aspects of the experience has become crucial as digital technology is now more prevalent in consumers’ daily lives than ever.
One USERindex for All
The USERindex was originally developed with digital products such as websites and mobile apps in mind. Soon after, it was successfully used to measure both the digital and hardware experiences of IoT devices.
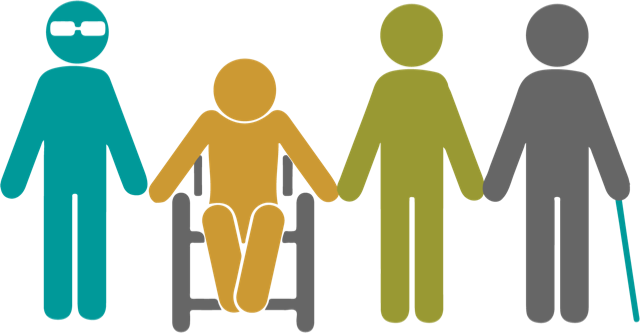
In the past few years, we have piloted the USERindex in inclusive design UX studies with participants with disabilities and people who use assistive technologies. Our conclusion is that the USERindex is suitable for capturing and measuring the experience of participants in inclusive design UX studies.
This is encouraging, since a significant portion of the world’s population has a disability of sorts; about 15 percent of the world’s population and 30 to 50 percent of older adults in the US. And let’s not forget people all over the world who break their arm or lose their glasses, resulting in a temporary disability.
Best Practices
Here are a few best practices for interpreting scores in inclusive design UX studies.
Track Disability and Assistive Tech
Benchmarks such as the USERindex rely on self-reported feedback as the user rates the statements. A person’s frame of reference can significantly influence their ratings. For example, screen reader users are accustomed to challenging user experiences. As a result, what may seem a poor experience to some is a “good” experience for screen reader users. This can skew the ratings and it is thus a good idea to track both the disability and the assistive technology used.
Define User Personas Based on Assistive Tech
The different types of disabilities (e.g. vision, cognitive, motor impairment) are broad categories that cover a number of conditions and severity of these conditions. This variety makes it challenging to define user personas based on condition. We have found that defining user personas primarily based on assistive technology works well to collect consistent data points since the experience heavily depends on the type of assistive tech used.
Learn Through Detailed Analysis
The USERindex is represented as a single score. Yet, reviewing the scores for each statement and dimension across participants can be very insightful and help identify specific areas where the digital product may be particularly lacking.
Our world needs to be inclusive; access to a benchmarking score to measure the digital experience for everyone is simply a must have.
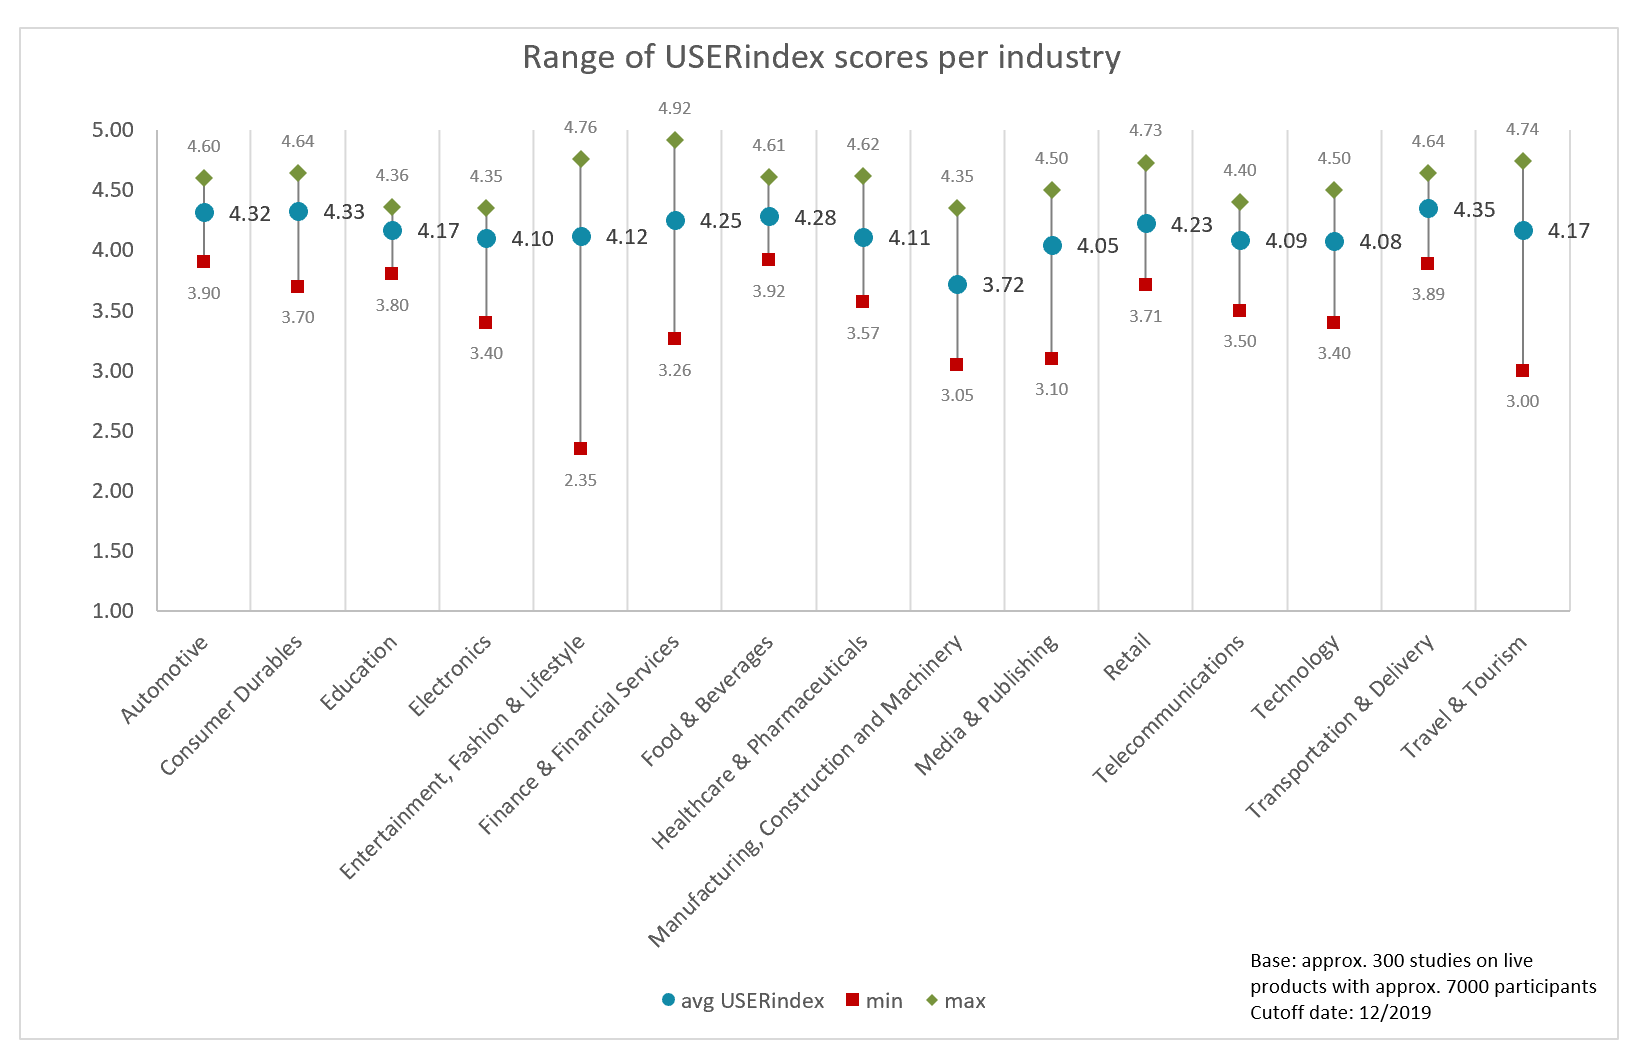
The average USERindex for 2019 is 4.26
The below chart shows the average USERindex (and minimum and maximum values) for different industries based on approx. 300 studies on live digital interfaces only (i.e. no prototypes or beta versions) with approx. 7000 participants:
| List of industries |
| Automotive e.g. vehicles, motorbikes |
| Consumer Durables e.g. home appliances, furniture, sports equipment, pet equipment |
| Education e.g. educational games, online learning |
| Electronics e.g consumer electronics |
| Entertainment, Fashion & Lifestyle e.g. toys, online games, video games, clothes and shoe brands |
| Finance & Financial Services e.g. banks, credit cards |
| Food & Beverages e.g. food manufacturers, restaurants |
| Healthcare & Pharmaceuticals |
| Manufacturing, Construction and Machinery |
| Media & Publishing e.g. television networks, newspapers, music and video streaming services |
| Retail e.g. supermarkets, groceries, D-I-Y, online shops |
| Telecommunications e.g. service providers |
| Technology e.g. software, cloud services |
| Transportation & Delivery e.g. carsharing, car rentals, railway and subways |
| Travel & Tourism e.g. hotels, airlines |
The average USERindex for 2018 is 4.16
The below chart shows the evolution of the USERindex across the different industries, devices and countries in the past 4 years:
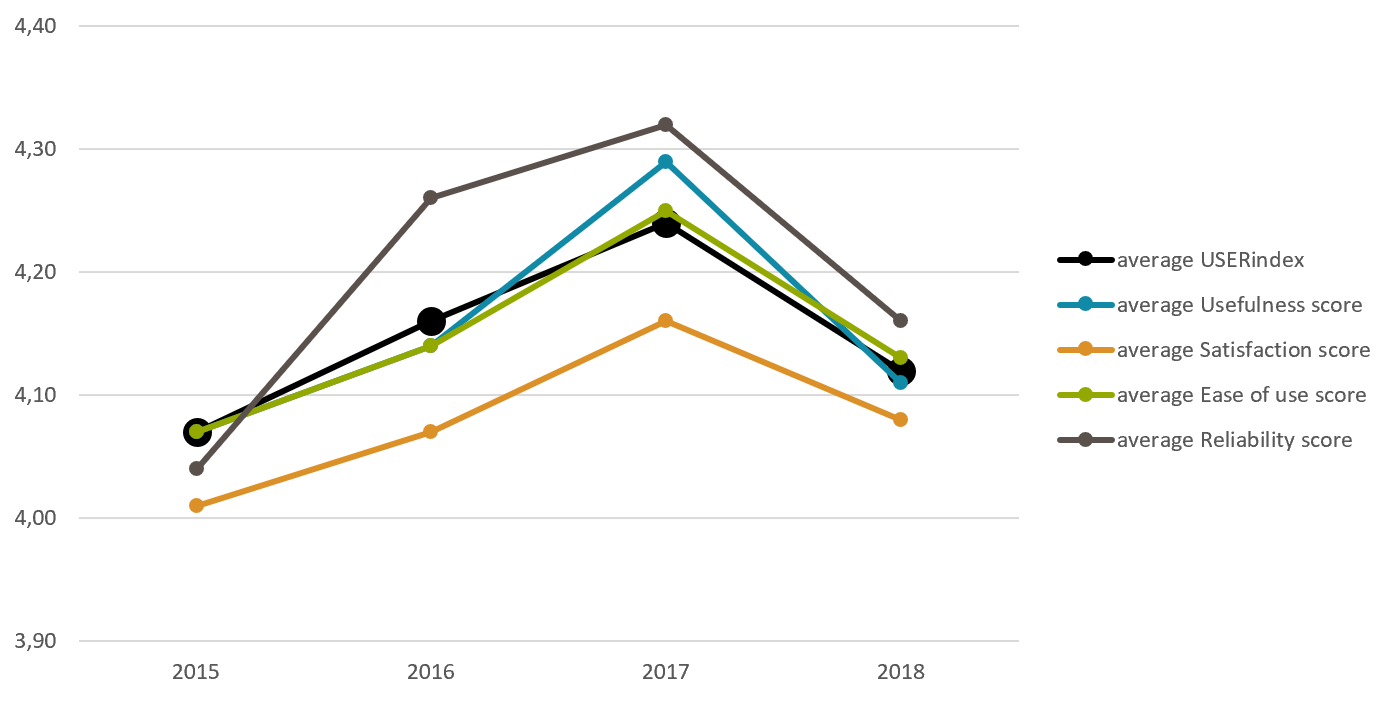
The average USERindex across all geographies and devices in 2017 was determined to be 4.17 (the 2016 average was 4.12).
The USERindex for websites used on desktop was measured at 4.17 while that of Android and iOS apps was 4.20
The following are some averages across various industries:
| Retail and Consumer durables: | 4.27 |
| Entertainment, Fashion, Sports & Lifestyle | 4.17 |
| Food and Beverages | 4.24 |
| Manufacturing | 4.16 |
| Telecommunications, Technology, Internet & Electronics | 3.94 |
The current average USERindex scores are based on results from 142 studies and 3531 participants across internet sites and mobile apps, collected from 2014 through 2016.
The current (2016) average USERindex is 4.12. The 2015 average was 4.07.
Some other averages:
| Overall USERindex | Usefulness | Satisfaction | Ease of Use | Reliability | |
| All devices and categories | 4.12 | 4.12 | 4.04 | 4.15 | 4.16 |
| Retail (all devices) | 4.26 | 4.24 | 4.14 | 4.37 | 4.27 |
| Desktop (all categories) | 4.25 | 4.11 | 4.14 | 4.04 | 4.15 |
| Responsive sites (across devices) | 4.09 | 4.08 | 3.93 | 4.20 | 4.12 |
2015 average USERindex is 4.07
The average USERindex measured in 56 studies and 1757 participants across internet sites and mobile apps in 2015 was 4.07.
On desktops, the average USERindex measured was 4.03, for native apps it was 4.07 and for mobile websites it was 4.14.
For the retail industry, the average USERindex was measured at 4.29 and for the Entertainment, Lifestyle industry it was 4.04.
Correlation between USERindex and NPS
In the studies where we asked for both the USERindex as well as the NPS, we could establish a positive correlation of between 0,274837 and 0.55606457 depending on how the data is sliced.