2019 USERindex values
The average USERindex for 2019 is 4.26
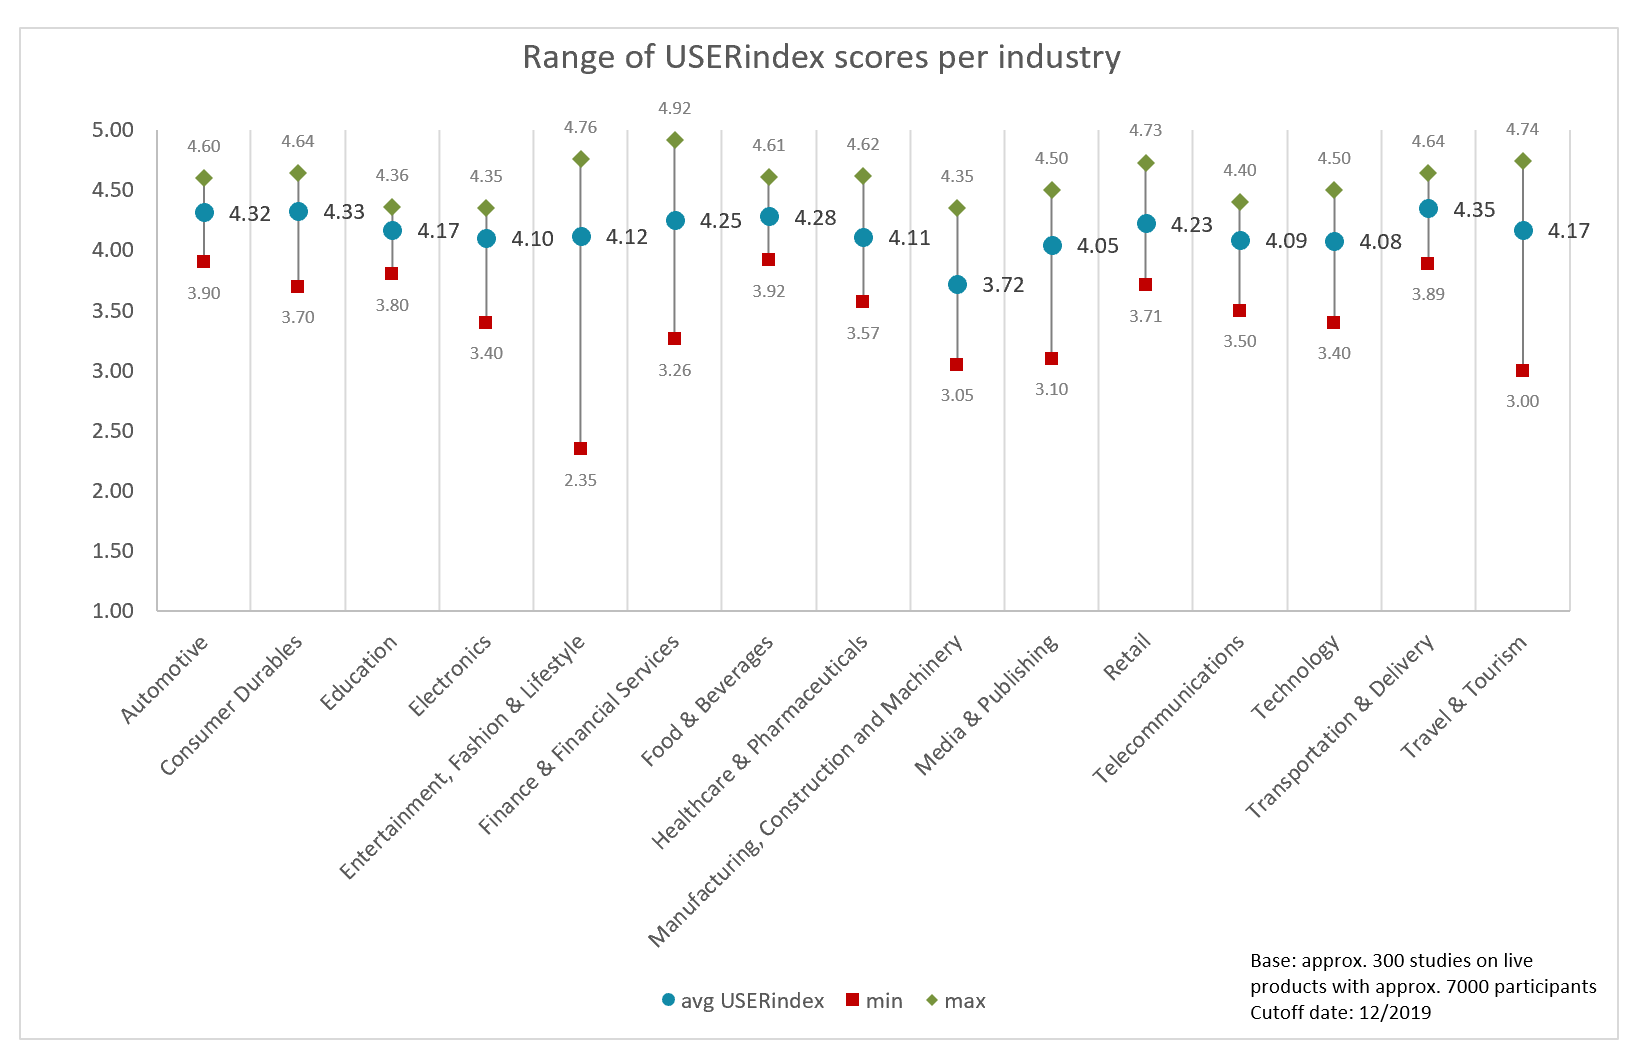
The below chart shows the average USERindex (and minimum and maximum values) for different industries based on approx. 300 studies on live digital interfaces only (i.e. no prototypes or beta versions) with approx. 7000 participants:
| List of industries |
| Automotive e.g. vehicles, motorbikes |
| Consumer Durables e.g. home appliances, furniture, sports equipment, pet equipment |
| Education e.g. educational games, online learning |
| Electronics e.g consumer electronics |
| Entertainment, Fashion & Lifestyle e.g. toys, online games, video games, clothes and shoe brands |
| Finance & Financial Services e.g. banks, credit cards |
| Food & Beverages e.g. food manufacturers, restaurants |
| Healthcare & Pharmaceuticals |
| Manufacturing, Construction and Machinery |
| Media & Publishing e.g. television networks, newspapers, music and video streaming services |
| Retail e.g. supermarkets, groceries, D-I-Y, online shops |
| Telecommunications e.g. service providers |
| Technology e.g. software, cloud services |
| Transportation & Delivery e.g. carsharing, car rentals, railway and subways |
| Travel & Tourism e.g. hotels, airlines |